Sales Forecasting with Time-Varying Autoregressive Models (Part 4)

Forecast real sales data

Retail Industry
Bayesian Inference
Autoregressive (AR) Models
Active Inference
RxInfer
Julia
Author

Kobus Esterhuysen

Published

June 19, 2024

Modified

October 12, 2024

In Part 3 we did the first forecast beyond the available synthetic data. In this part, we make use of real sales data. As before, we use RxInfer to learn the best order (2) as well as the parameters \(\boldsymbol\theta\) of the AR process. The inference process also learned the value of the transition precision parameter \(\gamma\) as well as the \(s_t\) state component which is the most recent sales amount.

versioninfo() ## Julia version
Julia Version 1.10.4
Commit 48d4fd48430 (2024-06-04 10:41 UTC)
Build Info:
  Official https://julialang.org/ release
Platform Info:
  OS: Linux (x86_64-linux-gnu)
  CPU: 12 × Intel(R) Core(TM) i7-8700B CPU @ 3.20GHz
  WORD_SIZE: 64
  LIBM: libopenlibm
  LLVM: libLLVM-15.0.7 (ORCJIT, skylake)
Threads: 1 default, 0 interactive, 1 GC (on 12 virtual cores)
Environment:
  JULIA_NUM_THREADS = 
import Pkg
Pkg.add(Pkg.PackageSpec(;name="RxInfer", version="3.6.0"))
Pkg.add(Pkg.PackageSpec(;name="Distributions", version="0.25.108"))
Pkg.add(Pkg.PackageSpec(;name="Random"))
Pkg.add(Pkg.PackageSpec(;name="Plots", version="1.40.1"))
Pkg.add(Pkg.PackageSpec(;name="LaTeXStrings", version="1.3.1"))
Pkg.add(Pkg.PackageSpec(;name="BenchmarkTools", version="1.5.0"))
Pkg.add(Pkg.PackageSpec(;name="Parameters", version="0.12.3"))
Pkg.add(Pkg.PackageSpec(;name="CSV", version="0.10.14"))
Pkg.add(Pkg.PackageSpec(;name="DataFrames", version="1.6.1"))

using RxInfer, Distributions, LinearAlgebra, Random, Plots, LaTeXStrings, BenchmarkTools, Parameters
using DataFrames, CSV
    Updating registry at `~/.julia/registries/General.toml`
   Resolving package versions...
  No Changes to `~/.julia/environments/v1.10/Project.toml`
  No Changes to `~/.julia/environments/v1.10/Manifest.toml`
   Resolving package versions...
  No Changes to `~/.julia/environments/v1.10/Project.toml`
  No Changes to `~/.julia/environments/v1.10/Manifest.toml`
   Resolving package versions...
  No Changes to `~/.julia/environments/v1.10/Project.toml`
  No Changes to `~/.julia/environments/v1.10/Manifest.toml`
   Resolving package versions...
  No Changes to `~/.julia/environments/v1.10/Project.toml`
  No Changes to `~/.julia/environments/v1.10/Manifest.toml`
   Resolving package versions...
  No Changes to `~/.julia/environments/v1.10/Project.toml`
  No Changes to `~/.julia/environments/v1.10/Manifest.toml`
   Resolving package versions...
  No Changes to `~/.julia/environments/v1.10/Project.toml`
  No Changes to `~/.julia/environments/v1.10/Manifest.toml`
   Resolving package versions...
  No Changes to `~/.julia/environments/v1.10/Project.toml`
  No Changes to `~/.julia/environments/v1.10/Manifest.toml`
   Resolving package versions...
  No Changes to `~/.julia/environments/v1.10/Project.toml`
  No Changes to `~/.julia/environments/v1.10/Manifest.toml`
   Resolving package versions...
  No Changes to `~/.julia/environments/v1.10/Project.toml`
  No Changes to `~/.julia/environments/v1.10/Manifest.toml`
Pkg.status()
Status `~/.julia/environments/v1.10/Project.toml`
  [6e4b80f9] BenchmarkTools v1.5.0
  [336ed68f] CSV v0.10.14
  [a93c6f00] DataFrames v1.6.1
⌃ [31c24e10] Distributions v0.25.108
  [b964fa9f] LaTeXStrings v1.3.1
  [d96e819e] Parameters v0.12.3
⌃ [91a5bcdd] Plots v1.40.1
  [86711068] RxInfer v3.6.0
  [9a3f8284] Random
Info Packages marked with ⌃ have new versions available and may be upgradable.
## macro h(x) ## for help
#     quote
#         display("text/markdown", @doc $x)
#     end    
# end
# @h Normal() ## help on Normal()

Our model for the Variational Bayesian Inference of a latent autoregressive model can be represented mathematically as follows:

\[\begin{aligned} p(\gamma) &= \mathcal{Gam}(\gamma|a, b)\\ p(\boldsymbol{\theta}) &= \mathcal{N}(\boldsymbol{\theta}|\mathbf{m}_{\theta}, \mathbf{V}_{\theta})\\ p(\mathbf{s}_t \mid \mathbf{s}_{t-1}, \boldsymbol{\theta}) &= \mathcal{N}\left(\mathbf{s}_t \mid \mathbf{B}\left(\boldsymbol{\theta}\right) \mathbf{s}_{t-1},\, \mathbf{V}(\gamma)\right)\\ p(x_t \mid \mathbf{s}_t) &= \mathcal{N}(x_t \mid \mathbf{s}_t, \tau^{-1}) \end{aligned}\]

where

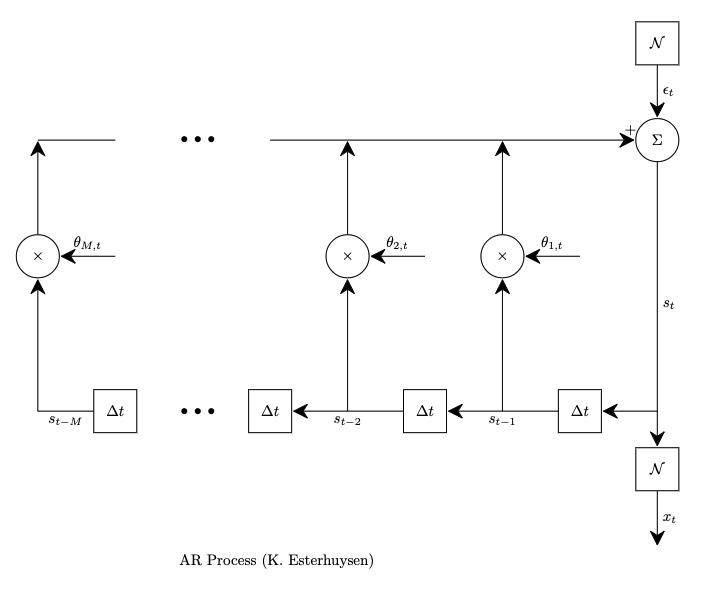
The following diagram represents an autoregressive process:

Autoregressive process

We downloaded the shampoo sales data from:

https://raw.githubusercontent.com/jbrownlee/Datasets/master/shampoo.csv

df = CSV.read("./shampoo.csv", DataFrame; delim=',')
df
36×2 DataFrame
11 rows omitted
Row Month Sales
Date Float64
1 0001-01-01 266.0
2 0001-02-01 145.9
3 0001-03-01 183.1
4 0001-04-01 119.3
5 0001-05-01 180.3
6 0001-06-01 168.5
7 0001-07-01 231.8
8 0001-08-01 224.5
9 0001-09-01 192.8
10 0001-10-01 122.9
11 0001-11-01 336.5
12 0001-12-01 185.9
13 0002-01-01 194.3
25 0003-01-01 339.7
26 0003-02-01 440.4
27 0003-03-01 315.9
28 0003-04-01 439.3
29 0003-05-01 401.3
30 0003-06-01 437.4
31 0003-07-01 575.5
32 0003-08-01 407.6
33 0003-09-01 682.0
34 0003-10-01 475.3
35 0003-11-01 581.3
36 0003-12-01 646.9
_ys = df.Sales
36-element Vector{Float64}:
 266.0
 145.9
 183.1
 119.3
 180.3
 168.5
 231.8
 224.5
 192.8
 122.9
   ⋮
 439.3
 401.3
 437.4
 575.5
 407.6
 682.0
 475.3
 581.3
 646.9
plot(
    _ys, 
    title="Shampoo sales data",
    xlabel=L"$\mathrm{time}, t$",
    color="orange",
    legend=false
)
scatter!(_ys, label=L"$\mathrm{Observation}, y_t$", color="orange")
_N = length(_ys) ## Number of observations of the sales data
_τ̃ = 0.001 ## assumed observation precision
0.001

Now we specify a probabilistic model, the inference constraints and then run an inference procedure with RxInfer. We need two different models for:

@model function lar_model(
x, ##. data/observations 
𝚃ᴬᴿ, ##. Uni/Multi variate 
Mᴬᴿ, ##. AR order
vᵤ, ##. unit vector 
τ) ##. observation precision     
    ## Priors
    γ  ~ Gamma= 1.0, β = 1.0) ##. for transition precision    
    if 𝚃ᴬᴿ === Multivariate
        θ  ~ MvNormal= zeros(Mᴬᴿ), Λ = diageye(Mᴬᴿ)) ##.kw μ,Λ only work inside macro
        s₀ ~ MvNormal= zeros(Mᴬᴿ), Λ = diageye(Mᴬᴿ)) ##.kw μ,Λ only work inside macro
    else ## Univariate
        θ  ~ Normal= 0.0, γ = 1.0)
        s₀ ~ Normal= 0.0, γ = 1.0)
    end
    sₜ₋₁ = s₀
    for t in eachindex(x)
        s[t] ~ AR(sₜ₋₁, θ, γ) #.Eq (2b)
        if 𝚃ᴬᴿ === Multivariate
            x[t] ~ Normal= dot(vᵤ, s[t]), γ = τ) #.Eq (2c)
        else
            x[t] ~ Normal= vᵤ*s[t], γ = τ) #.Eq (2c)
        end
        sₜ₋₁ = s[t]
    end
end
@constraints function ar_constraints() 
    q(s₀, s, θ, γ) = q(s₀, s)q(θ)q(γ)
end
ar_constraints (generic function with 1 method)
@meta function ar_meta(𝚃ᴬᴿ, Mᴬᴿ, stype)
    AR() -> ARMeta(𝚃ᴬᴿ, Mᴬᴿ, stype)
end
ar_meta (generic function with 1 method)
@initialization function ar_init(𝚃ᴬᴿ, Mᴬᴿ)
    q(γ) = GammaShapeRate(1.0, 1.0)
    if 𝚃ᴬᴿ === Multivariate    
        q(θ) = MvNormalMeanPrecision(zeros(Mᴬᴿ), diageye(Mᴬᴿ))
    else ## Univariate
        q(θ) = NormalMeanPrecision(0.0, 1.0)
    end
end
ar_init (generic function with 1 method)
function run_inference(Nmodels)
    results = Vector{Any}(undef, Nmodels)
    for m = 1:Nmodels
        println("m = $m")
        if m > 1 𝚃ᴬᴿ = Multivariate elseif m === 1 𝚃ᴬᴿ = Univariate
        else error("m=$m which is not an allowed value.") end    
        results[m] = infer(
            model = lar_model(
                𝚃ᴬᴿ=𝚃ᴬᴿ, ## Uni/Multi variate
                Mᴬᴿ=m, ## AR order
                vᵤ=ReactiveMP.ar_unit(𝚃ᴬᴿ, m), ##. unit vector
                τ=_τ̃), ## observation precision
            data = (x=_ys,),
            constraints   = ar_constraints(),
            meta          = ar_meta(𝚃ᴬᴿ, m, ARsafe()),
            options       = (limit_stack_depth = 100,),
            initialization = ar_init(𝚃ᴬᴿ, m),
            returnvars    = (s=KeepLast(), γ=KeepEach(), θ=KeepEach()),
            free_energy   = true,
            iterations    = 100,
            showprogress  = false
        )
    end
    return(results)
end       
run_inference (generic function with 1 method)

Now we run the inference for \(M^{AR}=1,2, ..., 7\):

_results = run_inference(7)
m = 1
m = 2
m = 3
m = 4
m = 5
m = 6
m = 7
7-element Vector{Any}:
 Inference results:
  Posteriors       | available for (γ, s, θ)
  Free Energy:     | Real[2307.28, 2306.57, 2306.14, 2305.47, 2304.17, 2300.56, 2281.64, 1974.21, 519.355, 294.064  …  233.459, 233.459, 233.459, 233.459, 233.459, 233.459, 233.459, 233.459, 233.459, 233.459]

 Inference results:
  Posteriors       | available for (γ, s, θ)
  Free Energy:     | Real[2310.67, 2309.05, 2308.53, 2307.72, 2305.85, 2298.13, 2217.31, 1287.08, 319.798, 308.913  …  224.107, 224.107, 224.107, 224.107, 224.107, 224.107, 224.107, 224.107, 224.107, 224.107]

 Inference results:
  Posteriors       | available for (γ, s, θ)
  Free Energy:     | Real[2314.14, 2311.41, 2310.77, 2309.86, 2307.58, 2296.03, 2149.49, 883.808, 338.662, 319.551  …  225.164, 225.164, 225.164, 225.164, 225.164, 225.164, 225.164, 225.164, 225.164, 225.164]

 Inference results:
  Posteriors       | available for (γ, s, θ)
  Free Energy:     | Real[2317.59, 2313.75, 2312.93, 2311.94, 2309.39, 2294.89, 2120.28, 682.592, 343.266, 318.891  …  225.049, 225.049, 225.049, 225.049, 225.049, 225.049, 225.049, 225.049, 225.049, 225.049]

 Inference results:
  Posteriors       | available for (γ, s, θ)
  Free Energy:     | Real[2320.95, 2316.12, 2315.06, 2313.97, 2311.15, 2294.08, 2108.39, 614.028, 347.413, 325.631  …  225.266, 225.266, 225.266, 225.266, 225.266, 225.266, 225.266, 225.266, 225.266, 225.266]

 Inference results:
  Posteriors       | available for (γ, s, θ)
  Free Energy:     | Real[2324.18, 2318.52, 2317.14, 2315.96, 2312.92, 2293.88, 2104.3, 600.624, 353.997, 334.202  …  225.888, 225.888, 225.888, 225.888, 225.888, 225.888, 225.888, 225.888, 225.888, 225.888]

 Inference results:
  Posteriors       | available for (γ, s, θ)
  Free Energy:     | Real[2327.28, 2320.94, 2319.22, 2317.92, 2314.64, 2293.59, 2097.21, 596.196, 362.09, 341.92  …  228.364, 228.364, 228.364, 228.364, 228.364, 228.364, 228.364, 228.364, 228.364, 228.364]
function plot_free_energy(results)
    p = plot(title="Bethe Free Energy", legend=:topright, xlabel="iterations")
    for m = 1:length(results)
        p = plot!(p, results[m].free_energy, label="AR$m")
    end
    return p
end
plot_free_energy (generic function with 1 method)
plot_free_energy(_results)
values = [_results[m].free_energy[end] for m in 1:length(_results)]
7-element Vector{Float64}:
 233.4585521436341
 224.10729518548234
 225.16366364288
 225.04948712417126
 225.2656225753958
 225.88766886863937
 228.36387001925232
function plot_converged_free_energy(results)
    values = [results[m].free_energy[end] for m in 1:length(results)]
    bar(
        1:length(results), 
        values, 
        legend=:none, 
        ylim=(220, 235), 
        title="Converged Free Energy vs AR Order"
    )
    xlabel!("AR order")
    ylabel!("Minimum Free Energy")
end
plot_converged_free_energy (generic function with 1 method)
plot_converged_free_energy(_results)
function plot_transition_precision(results)
    p = plot(title="Inferred transition precision", legend=:topright, xlabel="iterations")
    for m = 1:length(results)
        p = plot!(p, mean.(results[m].posteriors[:γ]), label="AR$m")
    end
    ## plot!(
    ##     p, [_γ̃], seriestype=:hline, color="red", linestyle=:dash, 
    ##     label=L"Real transition precision $\tilde{γ}$"
    ## )
    return p
end
plot_transition_precision (generic function with 1 method)
plot_transition_precision(_results)
Mᵇᵉˢᵗ = 2 ## best order
@unpack s, θ, γ = _results[Mᵇᵉˢᵗ].posteriors
Dict{Symbol, Vector} with 3 entries:
  :γ => GammaShapeRate{Float64}[GammaShapeRate{Float64}(a=19.0, b=8.76489), Gam…
  :s => MvNormalWeightedMeanPrecision{Float64, Vector{Float64}, Matrix{Float64}…
  :θ => MvNormalWeightedMeanPrecision{Float64, Vector{Float64}, Matrix{Float64}…
_p1 = plot(
    ## first.(_s̃s), ## first.() gives s̃ₜ, not the delayed s̃ₜ₋₁, s̃ₜ₋₂, ..., s̃ₜ₋ₘ₊₁
    title="AR, " * L"$M^{AR}=$" * "$Mᵇᵉˢᵗ",
    xlabel=L"time $t$",
    color="red",
    ## label=L"Hidden state component $\tilde{s}_t$"
)
_p1 = scatter!(_p1, _ys, label=L"Observation $x_t=y_t$", color="orange")
_p1 = plot!(
    _p1, first.(mean.(s)), 
    ribbon=first.(std.(s)), 
    fillalpha=0.2,
    label=L"Inferred state component $s_t$",
    color="green",
    legend=:topleft)

_p2 = plot(
    mean.(γ), ribbon=std.(γ), 
    fillalpha=0.2,
    label=L"Inferred transition precision $\gamma$", 
    color="green",
    legend=:topright,
    xlabel="iterations",
)
## _p2 = plot!(
##     [_γ̃], 
##     seriestype=:hline, 
##     color="red", #.
##     label=L"Real transition precision $\tilde{γ}$"
## )

_p3 = plot(_results[Mᵇᵉˢᵗ].free_energy, label="Bethe Free Energy", xlabel="iterations")
plot(_p1, _p2, _p3, layout=@layout([ a; b c ]))

Let’s look at a smaller range of data for the sake of interest:

_subrange = 20 : _N
plot(
    _subrange, 
    ## first.(_s̃s)[_subrange], 
    _ys[_subrange],
    title=L"Subrange of: AR, $M^{AR}=$"*"$Mᵇᵉˢᵗ",
    xlabel=L"time $t$",
    color="orange",
    label="",
)
scatter!(_subrange, _ys[_subrange], label=L"Observation $x_t=y_t$", color="orange")
plot!(
    _subrange, 
    first.(mean.(s))[_subrange],
    ribbon=sqrt.(first.(var.(s)))[_subrange],
    fillalpha=0.2,
    label=L"Inferred state component $s_t$",
    color="green",
    legend=:topleft
)

Finally, we look at how the learned AR coefficients converge:

let
= plot()
    θms = mean.(θ) ##. θ means
    θvs = var.(θ) ##. θ variances
    l = length(θms)
    edim(e) = (a) -> map(r -> r[e], a)
    for t in 1:length(first(θms)) #.
        tmp = latexstring("\$ \\theta_{$(t),t} \$")
= plot!(
            pθ, 
            θms |> edim(t),
            ribbon=θvs |> edim(t) .|> sqrt, 
            fillalpha=0.2,
            label="Inferred $tmp")
    end
    ## for t in 1:length(_θ̃)
    ##     tmp = latexstring("\$ \\theta_{$(t),t} \$")
    ##     pθ = plot!(
    ##         pθ, 
    ##         [ _θ̃[t] ],
    ##         seriestype=:hline, 
    ##         label="Real $tmp")
    ## end
    plot(
        pθ, 
        title=L"AR coefficients, $M^{AR}=$"*"$Mᵇᵉˢᵗ",
        xlabel=L"time $t$",
        legend=:outertopright, 
        size=(800, 450))
end

Finally, we forecast a number of values into the future. First, we find the best value for \(\theta\) and call it \(\theta^{\mathrm{best}}\).

_θᵇᵉˢᵗ = mean(θ[end])
2-element Vector{Float64}:
 0.2965791124328563
 0.761818040823176
_θᵇᵉˢᵗ[1], _θᵇᵉˢᵗ[2]
(0.2965791124328563, 0.761818040823176)

We decide to forecast 10 values into the future by having \(n^{\mathrm{fcast}}=10\).

_nᶠᶜᵃˢᵗ = 10 ## number of forecast values
10
_sᶠᶜᵃˢᵗ = Vector{Float64}(undef, _nᶠᶜᵃˢᵗ);
## concat existing data with forecast to get complete signal
_sᶜᵒᵐᵖˡ = [first.(mean.(s)); _sᶠᶜᵃˢᵗ]
46-element Vector{Float64}:
 222.90905563878627
 129.1080133548282
 186.21297486503656
 127.37251396388952
 184.72878035452712
 169.14974001867415
 222.77794801609144
 208.92250166252228
 207.7460747904912
 141.80814711064664
   ⋮
   6.8992974510635e-310
   6.8992974510635e-310
   6.89929745107774e-310
   6.89929745109197e-310
   6.8992974511062e-310
   6.89929745112043e-310
   6.89929745113466e-310
   6.8992974511489e-310
   6.8992974511631e-310

Now we calculate the forecast values:

for t in _N+1:_N+_nᶠᶜᵃˢᵗ
    _sᶜᵒᵐᵖˡ[t] = _θᵇᵉˢᵗ[1]*_sᶜᵒᵐᵖˡ[t-1] + _θᵇᵉˢᵗ[2]*_sᶜᵒᵐᵖˡ[t-2]
end
_sᶜᵒᵐᵖˡ
46-element Vector{Float64}:
 222.90905563878627
 129.1080133548282
 186.21297486503656
 127.37251396388952
 184.72878035452712
 169.14974001867415
 222.77794801609144
 208.92250166252228
 207.7460747904912
 141.80814711064664
   ⋮
 670.8915766914528
 686.8956411537476
 714.8162061472302
 735.2890475654945
 762.6312548243129
 786.3369623244342
 814.1973667801074
 840.519616449661
 869.5508046328555
## _subrange = 1:_N
_subrange = 1:_N
_pc1 = plot(
    ## _subrange,
    ## first.(_s̃s)[_subrange], ## first.() gives s̃ₜ, not the delayed s̃ₜ₋₁, s̃ₜ₋₂, ..., s̃ₜ₋ₘ₊₁
    title="AR, " * L"$M^{AR}=$" * "$Mᵇᵉˢᵗ",
    xlabel=L"time $t$",
    ## color="red",
    ## label=L"Hidden state component $\tilde{s}_t$",
    legend=:topleft)
_pc1 = scatter!(_pc1, 
    _subrange,
    _ys[_subrange], label=L"Observation $x_t=y_t$", color="orange")
_pc1 = plot!(_pc1, 
    _subrange,
    first.(mean.(s))[_subrange], 
    ribbon=first.(std.(s))[_subrange], 
    fillalpha=0.2,
    label=L"Inferred state component $s_t$",
    color="green")
_pc1 = plot!(_pc1, 
    _N+1:_N+_nᶠᶜᵃˢᵗ,
    _sᶜᵒᵐᵖˡ[_N+1:_N+_nᶠᶜᵃˢᵗ],
    title="AR, " * L"$M^{AR}=$" * "$Mᵇᵉˢᵗ",
    xlabel=L"time $t$",
    color="green",
    linestyle=:dash,
    label=L"Forecast state component $s^{\mathrm{fcast}}_t$")