import matplotlib.pyplot as plt
import matplotlib.ticker as ticker
from matplotlib.gridspec import GridSpec
from matplotlib.ticker import MaxNLocator
import numpy as np
import pandas as pd
import control as ct
from pathlib import Path

Part 3 implements a classical augmented LQR baseline on the same electric circuit and scenario as Part 2 §4.5.1 and §4.5.2: 10 ms horizon, L6-current tracking, pulse disturbance \(v_7(t)\).
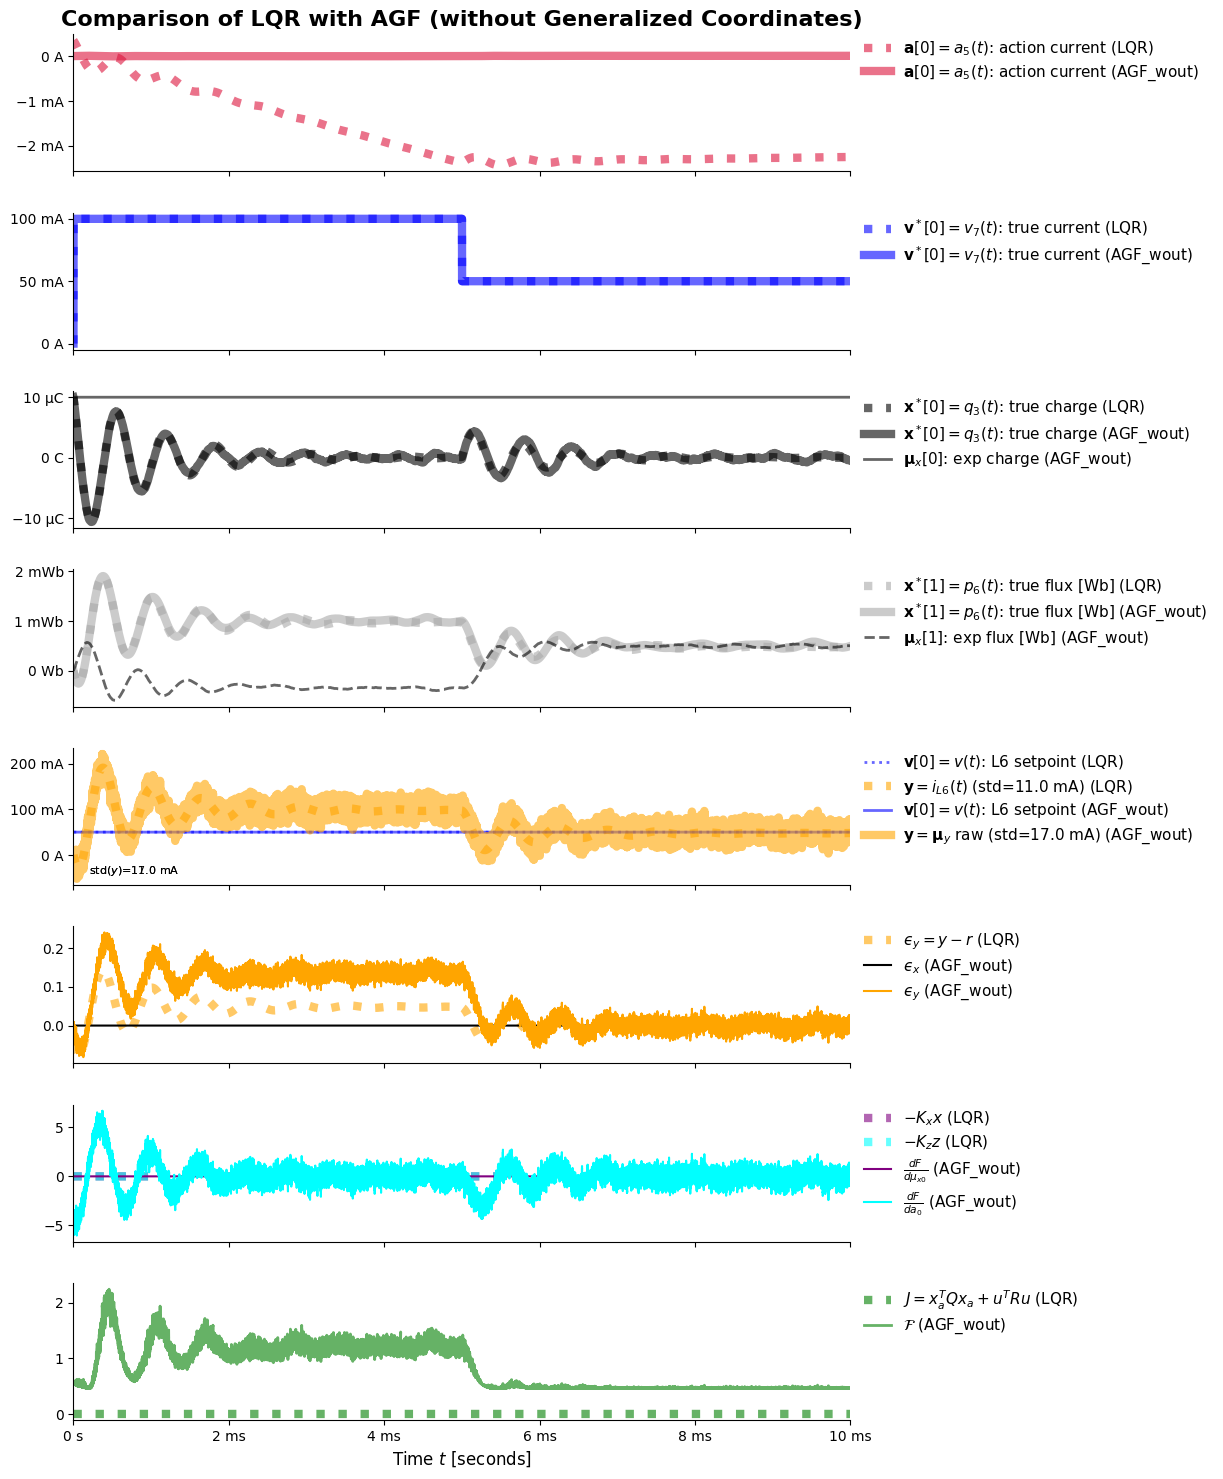
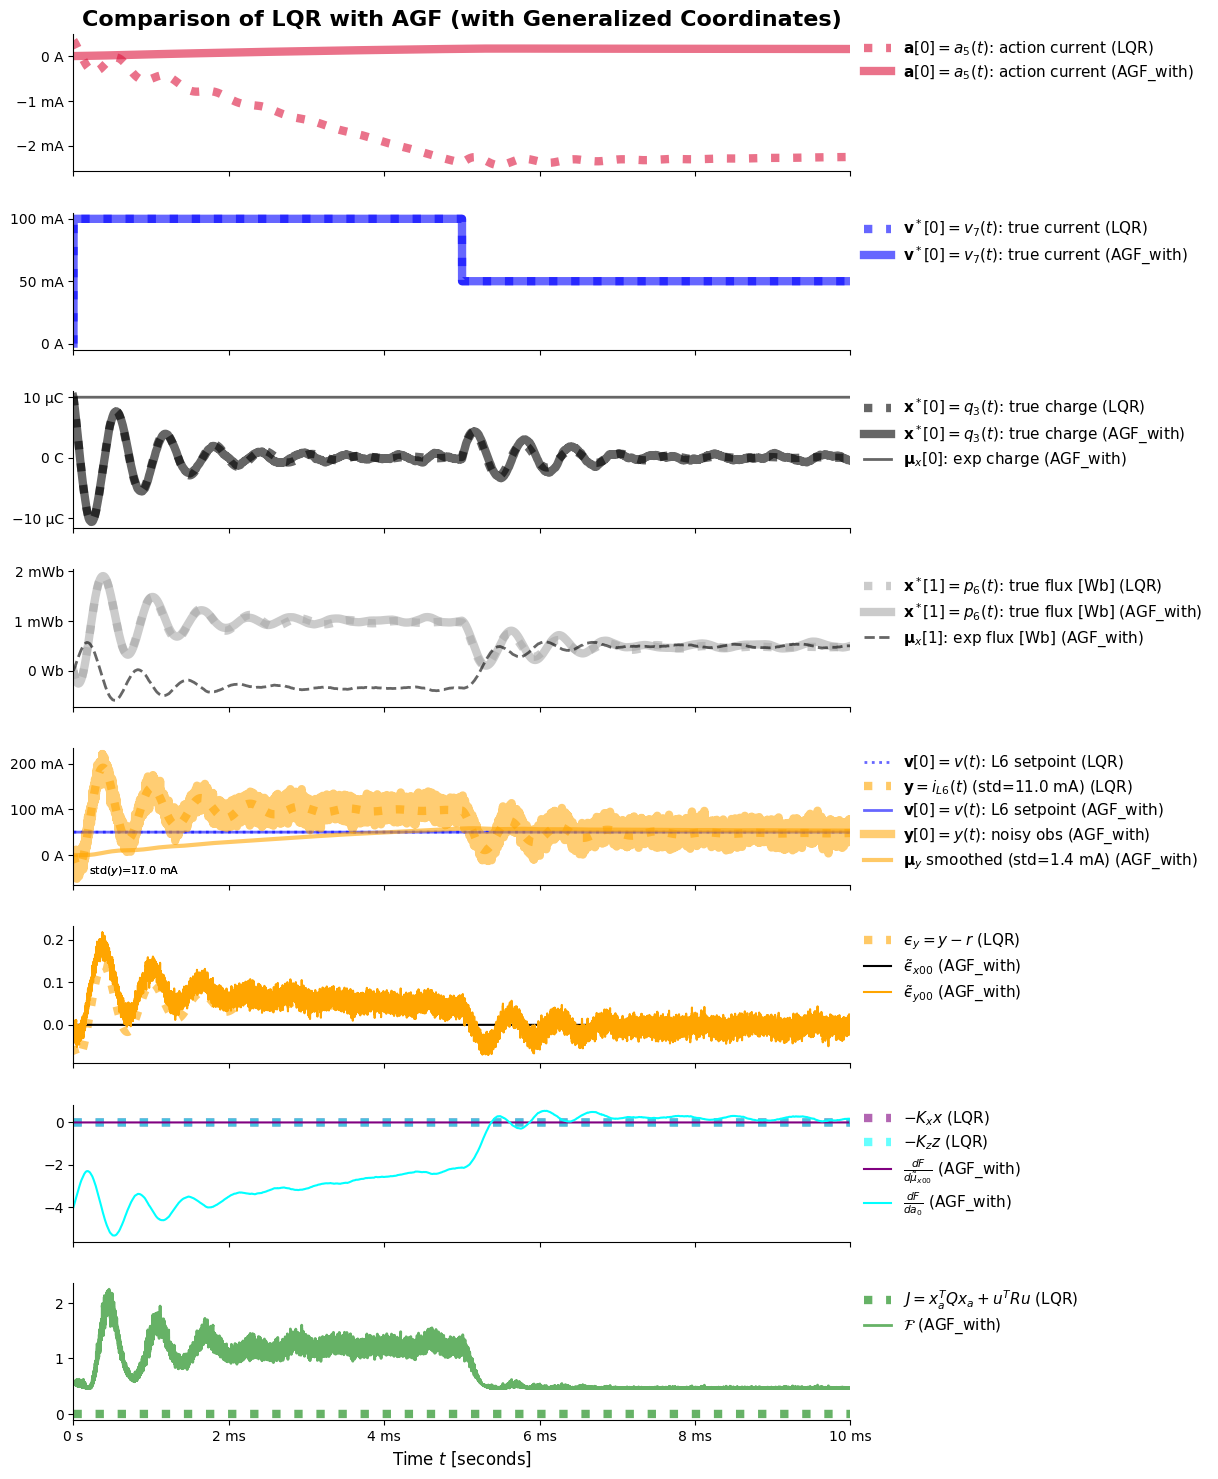
Run Part 2 §4.5.1 and §4.5.2 first to export AGF traces, then run the overlay cells below for side-by-side comparisons:
- LQR vs AGF_wout (without generalized coordinates)
- LQR vs AGF_with (with generalized coordinates)
A few coding conventions:
- Variable names will generally reflect the mathematical names, rather than descriptive names.
- Bold variable names usually start with an underscore, i.e. ’_’. That means all structured variables including vectors (i.e. tensors). The focus is on the code equivalents of the mathematics, i.e. not on Python structured variables, e.g. lists.
- Global variable names (i.e. used across cells) are usually indicated by the Python ‘global’ keyword
- External (i.e. true) states and parameters: The ‘^x’ symbol is used for code variables, i.e. ‘v^x’. In other words, superscript ‘x’ is used to imitate superscript ’*’ in code. In documentation the standard ‘\(v^*\)’ is used.
- This notebook follows a standardized framework. This is my own framework, developed over a number of years, and is informed by the CRISP-DM framework, the work of Warren Powell (Princeton), the work of Bert De Vries, the work of Karl Friston as well as that of the larger Active Inference community.
A few charting conventions:
- Linestyles
- ‘-’ for vector component 0
- ‘–’ for vector component 1
- ‘-.’ for vector component 2
- ‘:’ for vector component 3
- Widths
- Wide for Environment
- Narrow for Agent
- Colors
- ’C’rimsons / reds for ’C’ontrols / actions
- ’A’quas / blues for ’A’utonomous states
- Greys for hidden / latent states
- ’O’ranges for ’O’bservations
- ’F’orest-greens for ’F’ree energies (VFE, EFE, GFE, etc)
ALPHA = 0.6
LEGEND_FONTSIZE = 11
TITLE_FONTSIZE = 16
ENV_WIDTH = 6.
AGT_WIDTH = 2.
AGT_LINESTYLES = ['-', '--', '-.', ':']
ORANGE_HUE_BY_BRIGHTNESS = [
    "#FFA500",
    "#FFC04D",
    "#FFD699",
    "#FFE5CC",
]
ORANGE_HUE = ORANGE_HUE_BY_BRIGHTNESS
styles = {
    "a[0]": {"color": "crimson", "linestyle": "-", "linewidth": ENV_WIDTH, "alpha": ALPHA},
    "xˣ[0]": {"color": "black", "linestyle": "-", "linewidth": ENV_WIDTH, "alpha": ALPHA},
    "xˣ[1]": {"color": "darkgrey", "linestyle": "-", "linewidth": ENV_WIDTH, "alpha": ALPHA},
    "vˣ[0]": {"color": "blue", "linestyle": "-", "linewidth": ENV_WIDTH, "alpha": ALPHA},
    "y[0]": {"color": ORANGE_HUE[0], "linestyle": "-", "linewidth": ENV_WIDTH, "alpha": ALPHA},
    "v[0]": {"color": "blue", "linestyle": AGT_LINESTYLES[0], "linewidth": AGT_WIDTH, "alpha": ALPHA},
    "μ_x[0]": {"color": "black", "linestyle": AGT_LINESTYLES[0], "linewidth": AGT_WIDTH, "alpha": ALPHA},
    "μ_x[1]": {"color": "black", "linestyle": AGT_LINESTYLES[1], "linewidth": AGT_WIDTH, "alpha": ALPHA},
    "μ_y[0]": {"color": "orange", "linestyle": AGT_LINESTYLES[0], "linewidth": AGT_WIDTH, "alpha": ALPHA},
    "F": {"color": "green", "linestyle": "-", "linewidth": AGT_WIDTH, "alpha": ALPHA},
    "J": {"color": "green", "linestyle": "-", "linewidth": ENV_WIDTH, "alpha": ALPHA},
}
#### Scenario — matches P2 §4.5.0 / §4.5.1
tT = 10000e-6
Δt = 0.1e-6
ts = np.arange(0, tT, Δt)
T = len(ts)
C = 2
D = 1
A_dim = 1
B_d = 1
θˣ_x = {'C3': 1e-6, 'R2': 20.0, 'L6': 10e-3}
C3 = θˣ_x['C3']
R2 = θˣ_x['R2']
L6 = θˣ_x['L6']
setpoint = 50e-3
x0 = np.array([10e-6, 0.0])
def f_pulses(_t, **kwargs):
_amps = np.asarray(kwargs['amps'], dtype=float)
_t_ons = np.asarray(kwargs['t_ons'], dtype=float)
_t_offs = np.asarray(kwargs['t_offs'], dtype=float)
_t_arr = np.asarray(_t, dtype=float)
_val = np.zeros_like(_t_arr, dtype=float)
for amp, t_on, t_off in zip(_amps, _t_ons, _t_offs):
_val += amp * (
np.heaviside(_t_arr - t_on, 0.0)
- np.heaviside(_t_arr - t_off, 0.0)
)
return _val
v7_theta = {
'amps': [100e-3, 50e-3],
't_ons': [0., 5e-3],
't_offs': [5e-3, 1e10],
}
_v_dist = f_pulses(ts, **v7_theta)
_r = np.ones(T) * setpointdef run_lqr_augmented(*, ts, x0, _r, _d, θˣ_x, Q_x_diag=(1.0, 1.0), Q_z=10.0, R_u=0.1):
"""Augmented LQR with integrator on tracking error; returns time-series dict."""
C3 = float(θˣ_x['C3'])
R2 = float(θˣ_x['R2'])
L6 = float(θˣ_x['L6'])
_A = np.array([
[0.0, 1.0 / L6],
[-1.0 / C3, -R2 / L6],
])
_B_u = np.array([[-1.0], [R2]])
_B_d = np.array([[-1.0], [R2]])
_C = np.array([[0.0, 1.0 / L6]])
_A_a = np.block([
[_A, np.zeros((C, 1))],
[-_C, np.zeros((1, 1))],
])
_B_u_a = np.vstack([_B_u, np.zeros((1, 1))])
_B_d_a = np.vstack([_B_d, np.zeros((1, 1))])
_B_r_a = np.zeros((C + 1, 1))
_B_r_a[-1, 0] = 1.0
_Q_a = np.diag([Q_x_diag[0], Q_x_diag[1], Q_z])
_R_u_mat = np.array([[R_u]])
_K_a, _, _ = ct.lqr(_A_a, _B_u_a, _Q_a, _R_u_mat)
_K_a = np.asarray(_K_a)
_K_x = _K_a[:, :C]
_K_z = _K_a[:, C:]
_A_cl_a = _A_a - _B_u_a @ _K_a
_B_dw_r = np.hstack([_B_d_a, _B_r_a])
_C_a = np.hstack([_C, np.zeros((1, 1))])
_D_a = np.zeros((D, 2))
sys_cl = ct.ss(_A_cl_a, _B_dw_r, _C_a, _D_a)
_inputs = np.column_stack([_d, _r])
x0_a = np.zeros(C + 1)
x0_a[:C] = x0
resp = ct.forced_response(sys_cl, T=ts, U=_inputs.T, X0=x0_a)
_x_a = resp.states.T
_x = _x_a[:, :C]
_z = _x_a[:, C]
_y = resp.outputs.T
_u = -(_x @ _K_x.T + _z.reshape(-1, 1) @ _K_z.T)
_u_x = -(_x @ _K_x.T)
_u_z = -(_z.reshape(-1, 1) @ _K_z.T)
_ε_y = (_y[:, 0] - _r)
_J = np.array([
float(xa @ np.diag([Q_x_diag[0], Q_x_diag[1], Q_z]) @ xa + u * R_u * u)
for xa, u in zip(_x_a, _u[:, 0])
])
return {
't': ts,
'_a': _u,
'_vˣ': _d.reshape(-1, 1),
'_xˣ': _x,
'_y': _y,
'_v': _r.reshape(-1, 1),
'_z': _z,
'_ε_y': _ε_y,
'_u_x': _u_x,
'_u_z': _u_z,
'_J': _J,
}
def build_lqr_result(sim):
return pd.DataFrame({
't': sim['t'],
'_a_0': sim['_a'][:, 0],
'_vˣ_0': sim['_vˣ'][:, 0],
'_xˣ_0': sim['_xˣ'][:, 0],
'_xˣ_1': sim['_xˣ'][:, 1],
'_y_0': sim['_y'][:, 0],
'_v_0': sim['_v'][:, 0],
'_ε_y_0': sim['_ε_y'],
'_u_x_0': sim['_u_x'][:, 0],
'_u_z_0': sim['_u_z'][:, 0],
'_J_0': sim['_J'],
})def _dotted(style):
return {**style, 'linestyle': ':'}
def _lbl(text, controller):
return f'{text} ({controller})'
def _apply_legend(axis, *, outside=False, loc='upper left', ncol=1):
handles, labels = axis.get_legend_handles_labels()
if not handles:
return
n = len(handles)
common = dict(
fontsize=LEGEND_FONTSIZE,
labelcolor='black',
frameon=False,
borderpad=0.35,
labelspacing=0.35,
handlelength=1.8,
)
leg = None
if outside or n > 3:
leg = axis.legend(
**common,
loc='upper left',
bbox_to_anchor=(1.01, 1.0),
borderaxespad=0.0,
ncol=1 if n <= 5 else 2,
)
else:
leg = axis.legend(**common, loc=loc, ncol=ncol)
for text in leg.get_texts():
text.set_color('black')
text.set_alpha(1.0)
def _init_figure(*, title_line1='Agent', title_suffix='', legend_outside=False):
ylabelx = -0.3
ylabely = 0.3
grid_rows = 8
fig_w = 14 if legend_outside else 12
fig = plt.figure(figsize=(fig_w, 18))
gs = GridSpec(grid_rows, 1, figure=fig, height_ratios=[1] * grid_rows)
ax = [fig.add_subplot(gs[i]) for i in range(grid_rows)]
tN = tT
for j, axis in enumerate(ax):
axis.grid(False)
axis.set_xlim(0, tN)
axis.xaxis.set_major_locator(MaxNLocator(nbins=5))
axis.spines['top'].set_visible(False)
axis.spines['right'].set_visible(False)
if j < grid_rows - 1:
axis.set_xticklabels([])
if title_suffix:
ax[0].set_title(f'{title_line1}\n{title_suffix}', fontweight='bold', fontsize=TITLE_FONTSIZE)
else:
ax[0].set_title(title_line1, fontweight='bold', fontsize=TITLE_FONTSIZE)
bottom = ax[-1]
bottom.set_xlim(0, tN)
bottom.xaxis.set_major_locator(MaxNLocator(nbins=5))
bottom.xaxis.set_major_formatter(ticker.EngFormatter(unit='s'))
bottom.set_xlabel(r'$\mathrm{Time}\ t\ [\mathrm{seconds}]$', fontweight='bold', fontsize=12)
return fig, ax, ylabelx, ylabely
def _plot_agf_panels(ax, result_agt, ylabelx, ylabely, *, controller='AGF',
show_legend=True, legend_outside=False):
"""Exact panel layout/formatting from P2 plot_agent_result."""
with_gc = '_ϵ̃_x_0_0' in result_agt.columns
i = 0
ax[i].plot(result_agt['t'], result_agt['_a_0'], **styles['a[0]'],
label=_lbl(r'$\mathbf{a}[0]=a_5(t)$: action current', controller))
ax[i].yaxis.set_label_coords(ylabelx, ylabely)
ax[i].yaxis.set_major_formatter(ticker.EngFormatter(unit='A'))
if show_legend:
_apply_legend(ax[i], outside=legend_outside)
i = 1
ax[i].plot(result_agt['t'], result_agt['_vˣ_0'], **styles['vˣ[0]'],
label=_lbl(r'$\mathbf{v}^*[0]=v_7(t)$: true current', controller))
ax[i].yaxis.set_label_coords(ylabelx, ylabely)
ax[i].yaxis.set_major_formatter(ticker.EngFormatter(unit='A'))
if show_legend:
_apply_legend(ax[i], outside=legend_outside)
i = 2
ax[i].plot(result_agt['t'], result_agt['_xˣ_0'], **styles['xˣ[0]'],
label=_lbl(r'$\mathbf{x}^*[0]=q_3(t)$: true charge', controller))
ax[i].plot(result_agt['t'], result_agt['_μ_x_0'], **styles['μ_x[0]'],
label=_lbl(r'$\boldsymbol{μ}_x[0]$: exp charge', controller))
ax[i].yaxis.set_label_coords(ylabelx, ylabely)
ax[i].yaxis.set_major_formatter(ticker.EngFormatter(unit='C'))
if show_legend:
_apply_legend(ax[i], outside=legend_outside)
i = 3
ax[i].plot(result_agt['t'], result_agt['_xˣ_1'], **styles['xˣ[1]'],
label=_lbl(r'$\mathbf{x}^*[1]=p_6(t)$: true flux [Wb]', controller))
ax[i].plot(result_agt['t'], result_agt['_μ_x_1'], **styles['μ_x[1]'],
label=_lbl(r'$\boldsymbol{μ}_x[1]$: exp flux [Wb]', controller))
ax[i].yaxis.set_label_coords(ylabelx, ylabely)
ax[i].yaxis.set_major_formatter(ticker.EngFormatter(unit='Wb'))
if show_legend:
_apply_legend(ax[i], outside=legend_outside)
i = 4
_half = result_agt['t'] >= (tT / 2)
_std_y = np.std(result_agt['_y_0'][_half]) * 1e3
_std_my = np.std(result_agt['_μ_y_0'][_half]) * 1e3
ax[i].plot(result_agt['t'], result_agt['_v_0'], **styles['v[0]'],
label=_lbl(r'$\mathbf{v}[0]=v(t)$: L6 setpoint', controller))
if with_gc:
_sty_y = {**styles['y[0]'], 'alpha': 0.55}
ax[i].plot(result_agt['t'], result_agt['_y_0'], **_sty_y,
label=_lbl(r'$\mathbf{y}[0]=y(t)$: noisy obs', controller))
_sty_my = {**styles['μ_y[0]'], 'linewidth': 3.0}
ax[i].plot(result_agt['t'], result_agt['_μ_y_0'], **_sty_my,
label=_lbl(rf'$\mathbf{{\mu}}_y$ smoothed (std={_std_my:.1f} mA)', controller))
else:
ax[i].plot(result_agt['t'], result_agt['_y_0'], **styles['y[0]'],
label=_lbl(rf'$\mathbf{{y}}=\mathbf{{\mu}}_y$ raw (std={_std_my:.1f} mA)', controller))
ax[i].yaxis.set_label_coords(ylabelx, ylabely)
ax[i].yaxis.set_major_formatter(ticker.EngFormatter(unit='A'))
if show_legend:
_apply_legend(ax[i], outside=legend_outside)
ax[i].text(0.02, 0.05, rf'std($y$)={_std_y:.1f} mA',
transform=ax[i].transAxes, ha='left', va='bottom', fontsize=8)
i = 5
if with_gc:
ax[i].plot(result_agt['t'], result_agt['_ϵ̃_x_0_0'], color='black', linestyle='-',
label=_lbl(r'$\tilde{ϵ}_{x00}$', controller))
ax[i].plot(result_agt['t'], result_agt['_ϵ̃_y_0_0'], color='orange', linestyle='-',
label=_lbl(r'$\tilde{ϵ}_{y00}$', controller))
else:
ax[i].plot(result_agt['t'], result_agt['_ϵ_x_0'], color='black', linestyle='-',
label=_lbl(r'$ϵ_{x}$', controller))
ax[i].plot(result_agt['t'], result_agt['_ϵ_y_0'], color='orange', linestyle='-',
label=_lbl(r'$ϵ_{y}$', controller))
ax[i].yaxis.set_label_coords(ylabelx, ylabely)
if show_legend:
_apply_legend(ax[i], outside=legend_outside, loc='lower left')
i = 6
if with_gc:
ax[i].plot(result_agt['t'], result_agt['_dF___dμ̃ₓ_0_0'], color='purple', linestyle='-',
label=_lbl(r'$\frac{dF}{d\tilde{μ}_{x00}}$', controller))
else:
ax[i].plot(result_agt['t'], result_agt['_dF___dμₓ_0'], color='purple', linestyle='-',
label=_lbl(r'$\frac{dF}{dμ_{x0}}$', controller))
ax[i].plot(result_agt['t'], result_agt['_dF___da_0'], color='cyan', linestyle='-',
label=_lbl(r'$\frac{dF}{da_{0}}$', controller))
ax[i].yaxis.set_label_coords(ylabelx, ylabely)
if show_legend:
_apply_legend(ax[i], outside=legend_outside, loc='upper right')
i = 7
ax[i].plot(result_agt['t'], result_agt['F'], **styles['F'],
label=_lbl(r'$\cal F$', controller))
ax[i].yaxis.set_label_coords(ylabelx, ylabely)
if show_legend:
_apply_legend(ax[i], outside=legend_outside, loc='upper right')
def _plot_lqr_panels(ax, result_lqr, ylabelx, ylabely, *, controller='LQR',
show_legend=True, legend_outside=False):
"""Mirror P2 plot_agent_result layout; all LQR traces use dotted lines."""
i = 0
ax[i].plot(result_lqr['t'], result_lqr['_a_0'], **_dotted(styles['a[0]']),
label=_lbl(r'$\mathbf{a}[0]=a_5(t)$: action current', controller))
ax[i].yaxis.set_label_coords(ylabelx, ylabely)
ax[i].yaxis.set_major_formatter(ticker.EngFormatter(unit='A'))
if show_legend:
_apply_legend(ax[i], outside=legend_outside)
i = 1
ax[i].plot(result_lqr['t'], result_lqr['_vˣ_0'], **_dotted(styles['vˣ[0]']),
label=_lbl(r'$\mathbf{v}^*[0]=v_7(t)$: true current', controller))
ax[i].yaxis.set_label_coords(ylabelx, ylabely)
ax[i].yaxis.set_major_formatter(ticker.EngFormatter(unit='A'))
if show_legend:
_apply_legend(ax[i], outside=legend_outside)
i = 2
ax[i].plot(result_lqr['t'], result_lqr['_xˣ_0'], **_dotted(styles['xˣ[0]']),
label=_lbl(r'$\mathbf{x}^*[0]=q_3(t)$: true charge', controller))
ax[i].yaxis.set_label_coords(ylabelx, ylabely)
ax[i].yaxis.set_major_formatter(ticker.EngFormatter(unit='C'))
if show_legend:
_apply_legend(ax[i], outside=legend_outside)
i = 3
ax[i].plot(result_lqr['t'], result_lqr['_xˣ_1'], **_dotted(styles['xˣ[1]']),
label=_lbl(r'$\mathbf{x}^*[1]=p_6(t)$: true flux [Wb]', controller))
ax[i].yaxis.set_label_coords(ylabelx, ylabely)
ax[i].yaxis.set_major_formatter(ticker.EngFormatter(unit='Wb'))
if show_legend:
_apply_legend(ax[i], outside=legend_outside)
i = 4
_half = result_lqr['t'] >= (tT / 2)
_std_y = np.std(result_lqr['_y_0'][_half]) * 1e3
ax[i].plot(result_lqr['t'], result_lqr['_v_0'], **_dotted(styles['v[0]']),
label=_lbl(r'$\mathbf{v}[0]=v(t)$: L6 setpoint', controller))
ax[i].plot(result_lqr['t'], result_lqr['_y_0'], **_dotted(styles['y[0]']),
label=_lbl(rf'$\mathbf{{y}}=i_{{L6}}(t)$ (std={_std_y:.1f} mA)', controller))
ax[i].yaxis.set_label_coords(ylabelx, ylabely)
ax[i].yaxis.set_major_formatter(ticker.EngFormatter(unit='A'))
if show_legend:
_apply_legend(ax[i], outside=legend_outside)
ax[i].text(0.02, 0.05, rf'std($y$)={_std_y:.1f} mA',
transform=ax[i].transAxes, ha='left', va='bottom', fontsize=8)
i = 5
ax[i].plot(result_lqr['t'], result_lqr['_ε_y_0'], color='orange', linestyle=':',
linewidth=ENV_WIDTH, alpha=ALPHA,
label=_lbl(r'$ϵ_y = y-r$', controller))
ax[i].yaxis.set_label_coords(ylabelx, ylabely)
if show_legend:
_apply_legend(ax[i], outside=legend_outside, loc='lower left')
i = 6
ax[i].plot(result_lqr['t'], result_lqr['_u_x_0'], color='purple', linestyle=':',
linewidth=ENV_WIDTH, alpha=ALPHA,
label=_lbl(r'$-K_x x$', controller))
ax[i].plot(result_lqr['t'], result_lqr['_u_z_0'], color='cyan', linestyle=':',
linewidth=ENV_WIDTH, alpha=ALPHA,
label=_lbl(r'$-K_z z$', controller))
ax[i].yaxis.set_label_coords(ylabelx, ylabely)
if show_legend:
_apply_legend(ax[i], outside=legend_outside, loc='upper right')
i = 7
ax[i].plot(result_lqr['t'], result_lqr['_J_0'], **_dotted(styles['J']),
label=_lbl(r'$J = x_a^T Q x_a + u^T R u$', controller))
ax[i].yaxis.set_label_coords(ylabelx, ylabely)
if show_legend:
_apply_legend(ax[i], outside=legend_outside, loc='upper right')
def _finalize_figure(*, legend_outside=False):
right = 0.68 if legend_outside else 0.95
plt.subplots_adjust(hspace=0.3, right=right)
def plot_agent_result(result_agt, *, title_suffix='', agf_controller='AGF'):
fig, ax, ylabelx, ylabely = _init_figure(title_line1='Agent', title_suffix=title_suffix)
_plot_agf_panels(ax, result_agt, ylabelx, ylabely, controller=agf_controller)
_finalize_figure()
plt.show()
return fig
def plot_lqr_result(result_lqr, *, title_suffix='(augmented LQR)'):
fig, ax, ylabelx, ylabely = _init_figure(title_line1='LQR', title_suffix=title_suffix)
_plot_lqr_panels(ax, result_lqr, ylabelx, ylabely, controller='LQR')
_finalize_figure()
plt.show()
return fig
def plot_comparison(result_lqr, result_agt, *, title, agf_controller='AGF_wout'):
fig, ax, ylabelx, ylabely = _init_figure(title_line1=title, legend_outside=True)
_plot_lqr_panels(ax, result_lqr, ylabelx, ylabely, controller='LQR', show_legend=False)
_plot_agf_panels(ax, result_agt, ylabelx, ylabely, controller=agf_controller,
legend_outside=True)
_finalize_figure(legend_outside=True)
plt.show()
return figsim_lqr = run_lqr_augmented(ts=ts, x0=x0, _r=_r, _d=_v_dist, θˣ_x=θˣ_x)
result_lqr = build_lqr_result(sim_lqr)
fig_lqr = plot_lqr_result(result_lqr)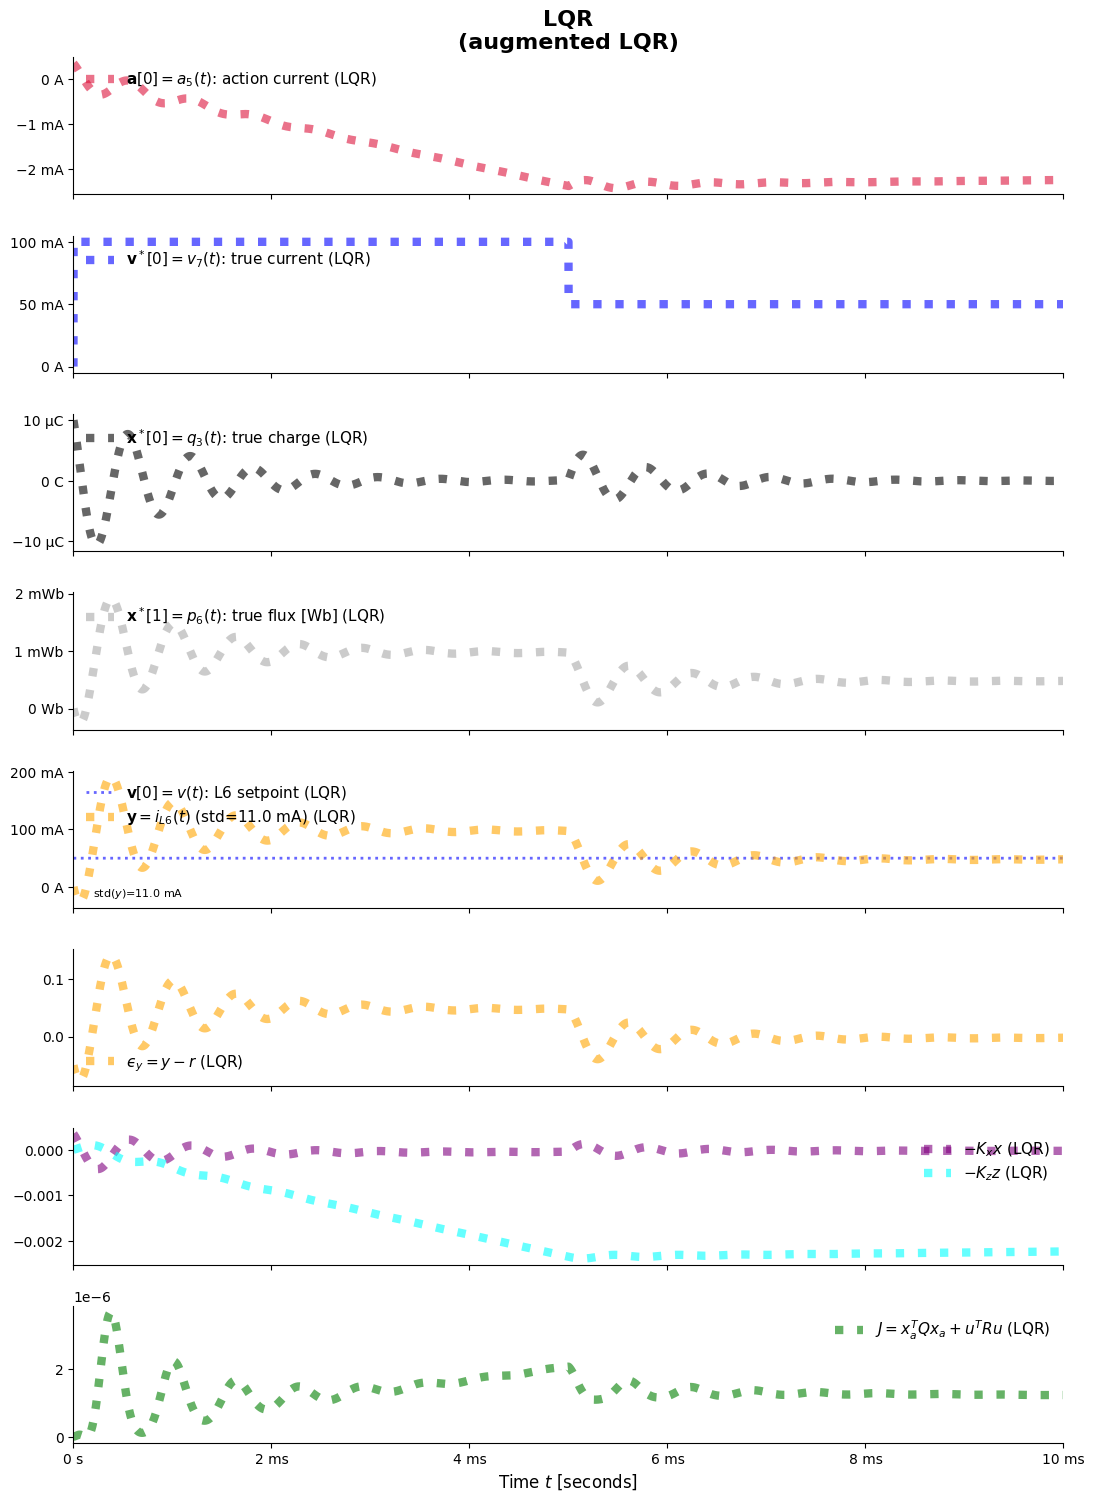
path_wout = Path('results/result_agt_wout.pkl')
path_with = Path('results/result_agt_with.pkl')

if path_wout.exists():
    result_agt_wout = pd.read_pickle(path_wout)
    fig_cmp_wout = plot_comparison(
        result_lqr,
        result_agt_wout,
        title='Comparison of LQR with AGF (without Generalized Coordinates)',
        agf_controller='AGF_wout',
    )
else:
    print('Run P2 §4.5.1 first to create results/result_agt_wout.pkl')

if path_with.exists():
    result_agt_with = pd.read_pickle(path_with)
    fig_cmp_with = plot_comparison(
        result_lqr,
        result_agt_with,
        title='Comparison of LQR with AGF (with Generalized Coordinates)',
        agf_controller='AGF_with',
    )
else:
    print('Run P2 §4.5.2 first to create results/result_agt_with.pkl')